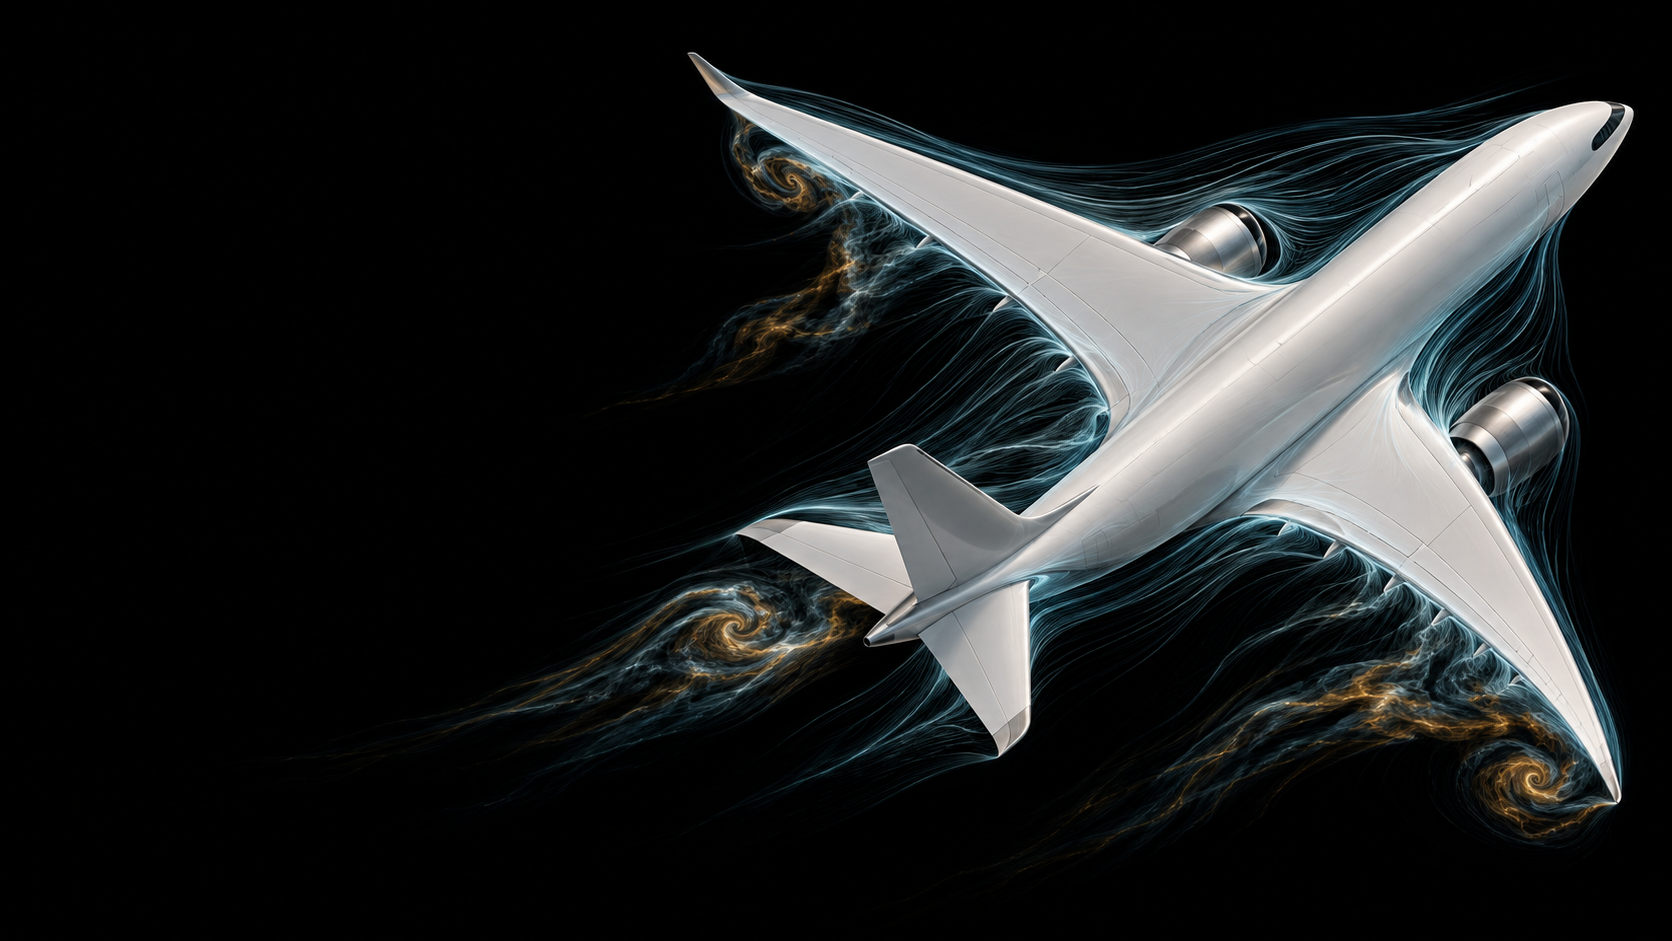
Conceptual aircraft surrounded by airflow filaments

Physical Sciences and Engineering  |  AI+X

Zurich · Oct 1st

World models
for
fluid dynamics

Cristian Bodnar

Project Prometheus

Worlds we can generate

SoraVideo generation
CosmosPhysical AI
Sora (2024), OpenAI · Cosmos-Predict1 (2025), NVIDIA · Generated demonstrations
Illustrative aircraft with airflow

How much
lift?

Pressure. Shear. Forces.

For this geometry, at this speed.

Conceptual illustration · no simulated values

Physics already gives us
world models

∇·𝒖=0
ρ(∂𝒖∂t+(𝒖·∇)𝒖)=−∇p+μ∇2𝒖+ρ𝒃

Numerical simulations are
the wrong inference engine

Reusable

Physical laws

F(u) = 0

The equations

Each case
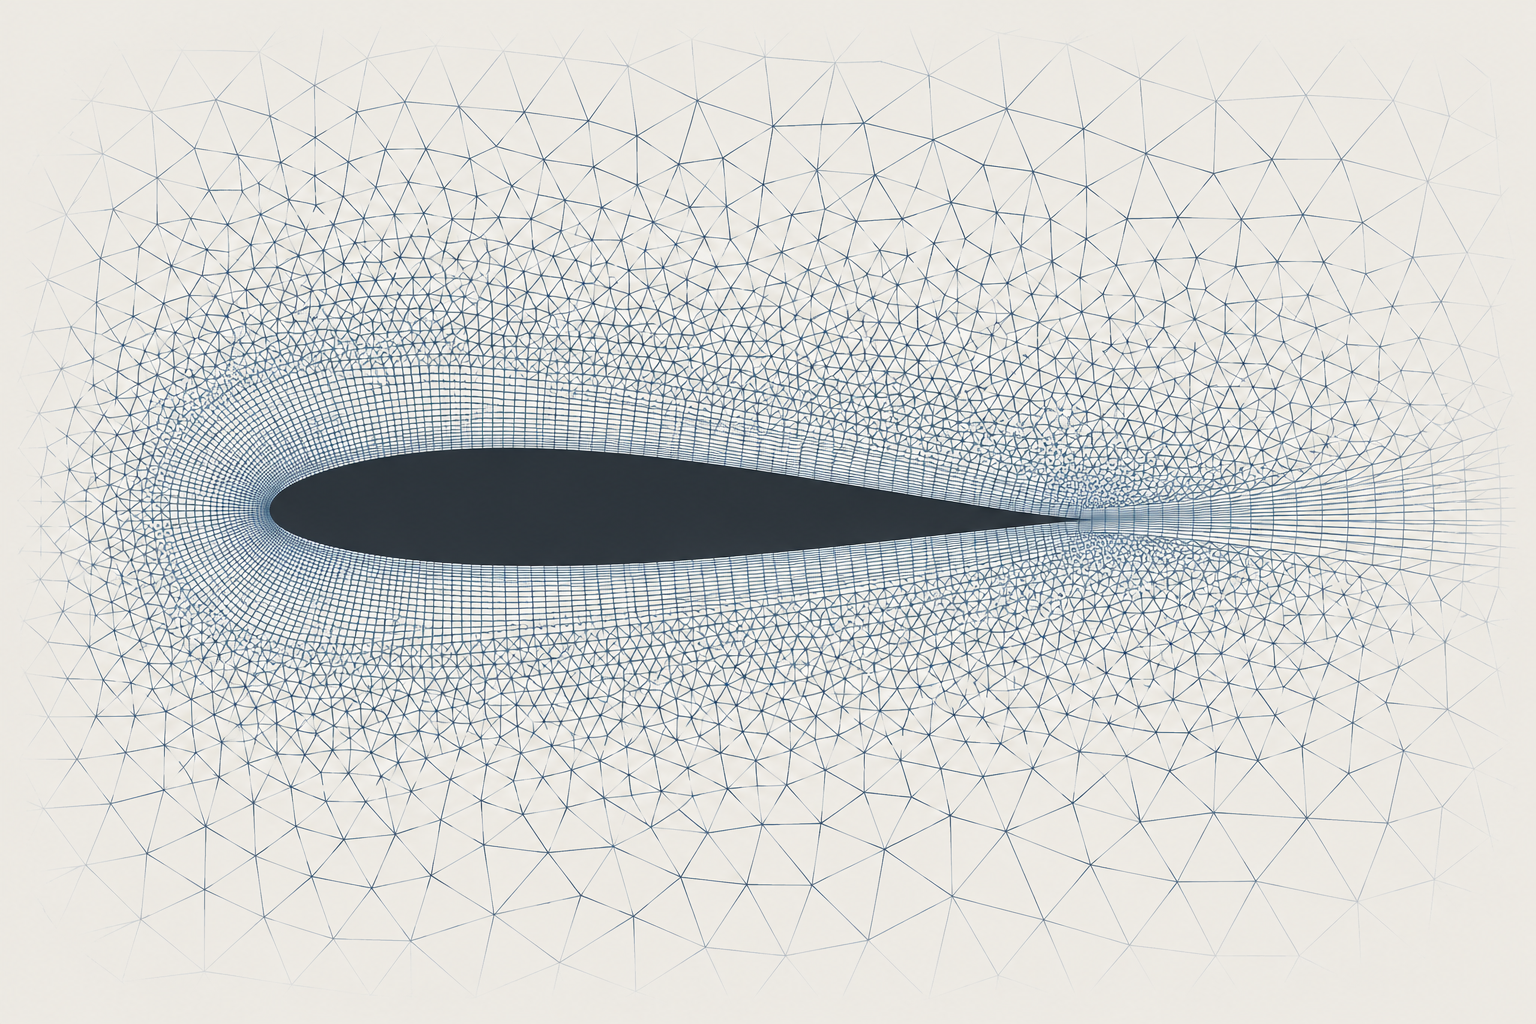
x Conceptual mesh prepared for a new geometry u0 → ··· → uN y

New design

Prepare mesh

Run simulation

Prediction

This computation repeats

Distilling reality into
neural networks

Training

Observations
+ simulations

θ

Learned weights

Inference
x Gθ ŷ

New case

Reuse the weights

Fast, mesh-free inference

Today: narrow surrogates

Training distribution

Deployment

Variations of a car

An unseen geometry

Accurate on cars ≠ reliable on motorcycles

A foundation model
for the
Earth system

Aurora

Bodnar et al. · Nature, 2025

Pre-training:
from next token to next state

LLMs

The sky is

Transformer

blue

Next token

Aurora

xt−Δt, xt

3D Swin
Transformer

xt+Δt

Next state · Δt ahead

Aurora architecture: 3D Perceiver encoder, 3D Swin Transformer backbone, and 3D Perceiver decoder Aurora · Bodnar et al., Nature 2025 · Architecture from the original presentation

More pretraining data,
better forecasts
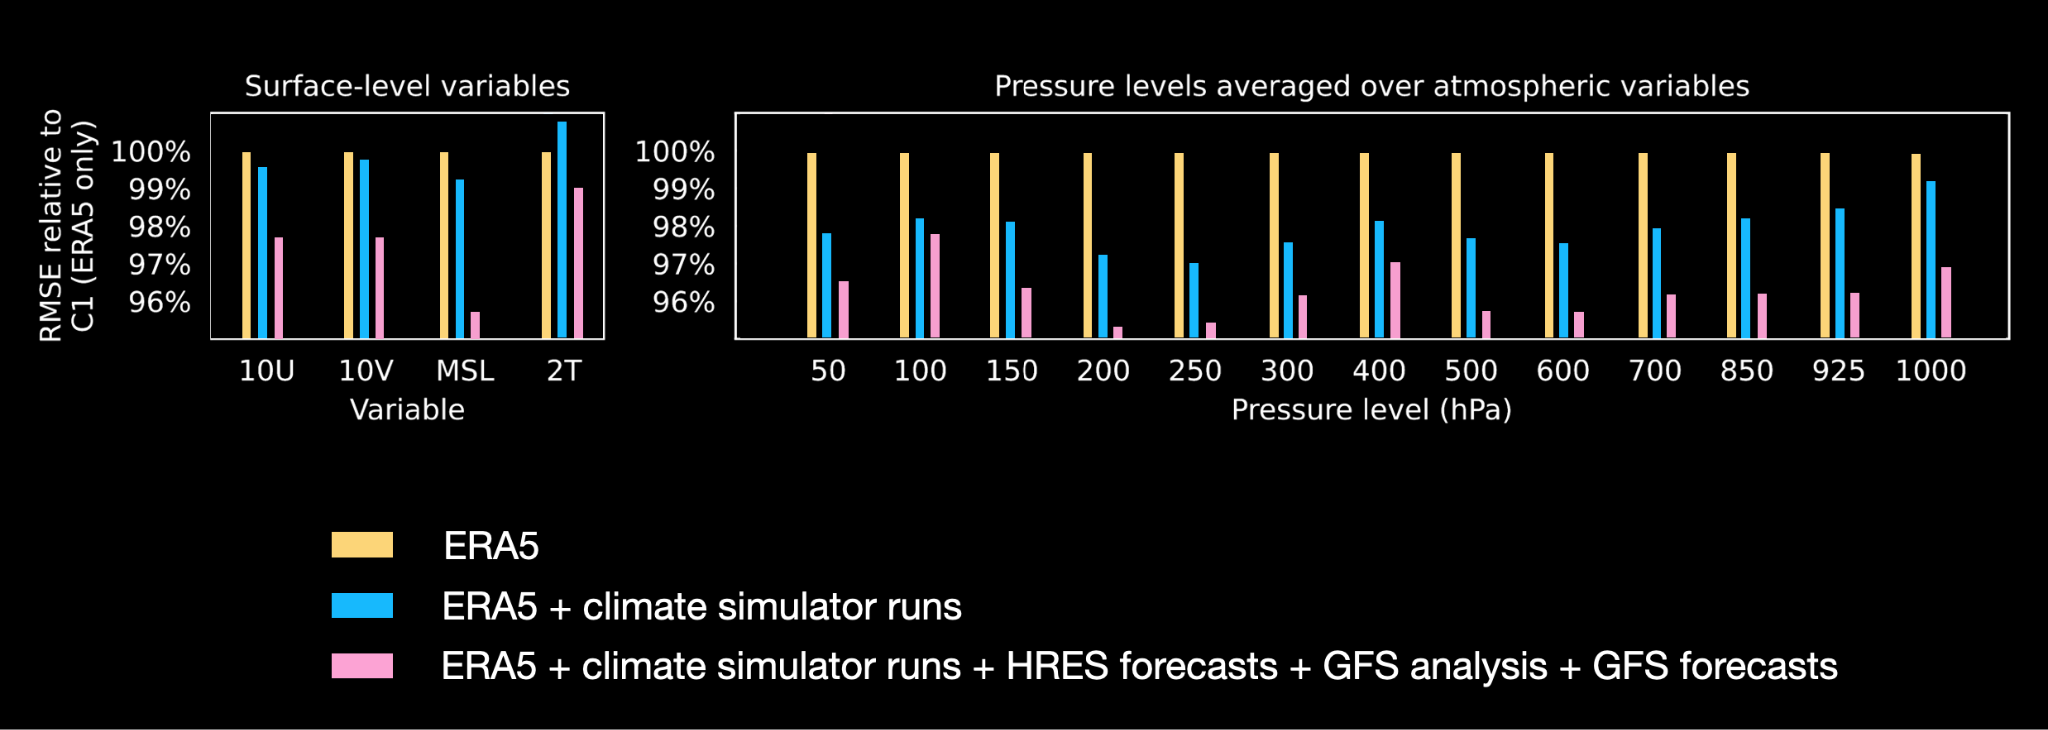
Original data ablation: ERA5 only, then added climate simulations, then the full HRES/GFS mixture; RMSE relative to ERA5-only training
Original data ablation · RMSE relative to ERA5-only training; lower is better · Aurora, Nature 2025

Larger pretrained models
improve forecast quality

Aurora models from 113 million to 1.3 billion parameters: HRES validation loss versus GPU hours, training tokens, and parameter count

113 million → 1.3 billion parameters

Original model-scaling study · Lower validation loss is better · Aurora, Nature 2025

One foundation.
Four forecasts.

Air quality

Ocean waves

Cyclones

Weather

Separate task-specific fine-tuning from a shared pretrained model · Aurora, Nature 2025

Air quality couples
physics and chemistry

Physics from pre-training

Chemistry via post-training

Wind + mixing Reactions Temperature + sunlight

Emitted pollutants

Moved and dispersed

Changed composition

∂ci/∂t = 𝒯i(c; u, K) + ℛi(c; T, J)

Aurora, Nature 2025 · Schematic processes; learned jointly after adaptation · Equation omits emissions and removal

Capturing the day–night cycle

Sunlight breaks down NO₂. At night, this loss switches off.
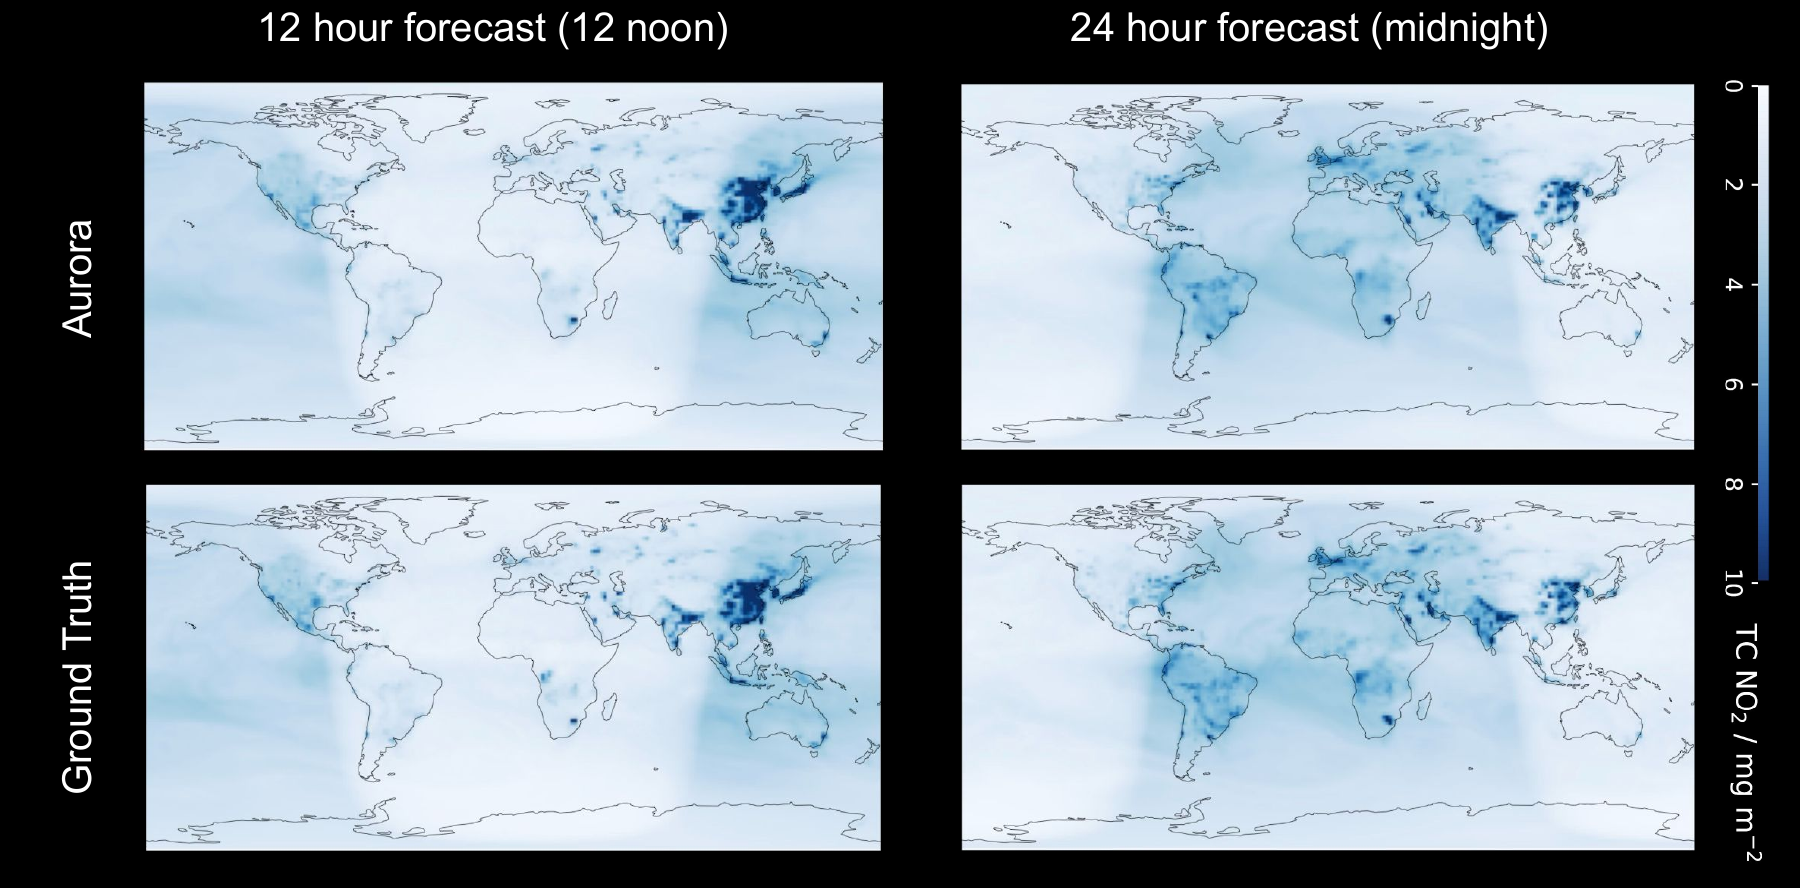
Aurora and ground truth total-column nitrogen dioxide at 12 and 24 hours, with original units
Original slide 12 · Aurora, Nature 2025

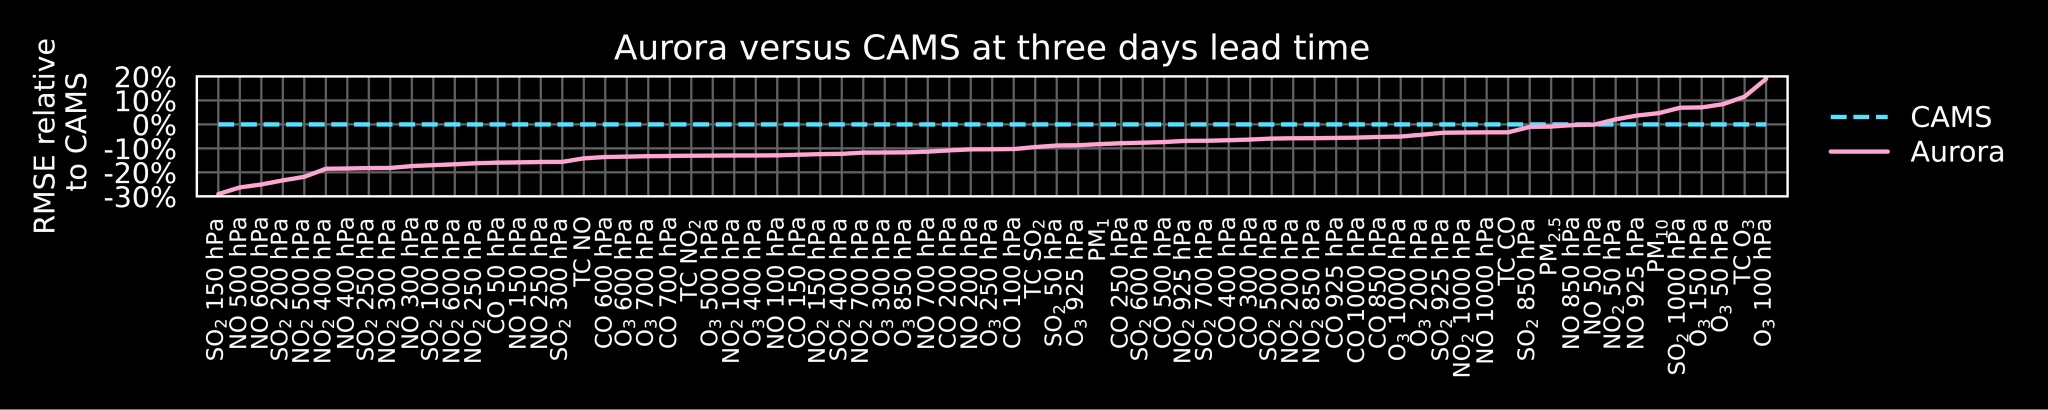
Air quality vs CAMS

CAMS: Europe’s air-pollution forecasting system

Baseline: global physics + chemistry forecast

Below zero → Aurora has lower error
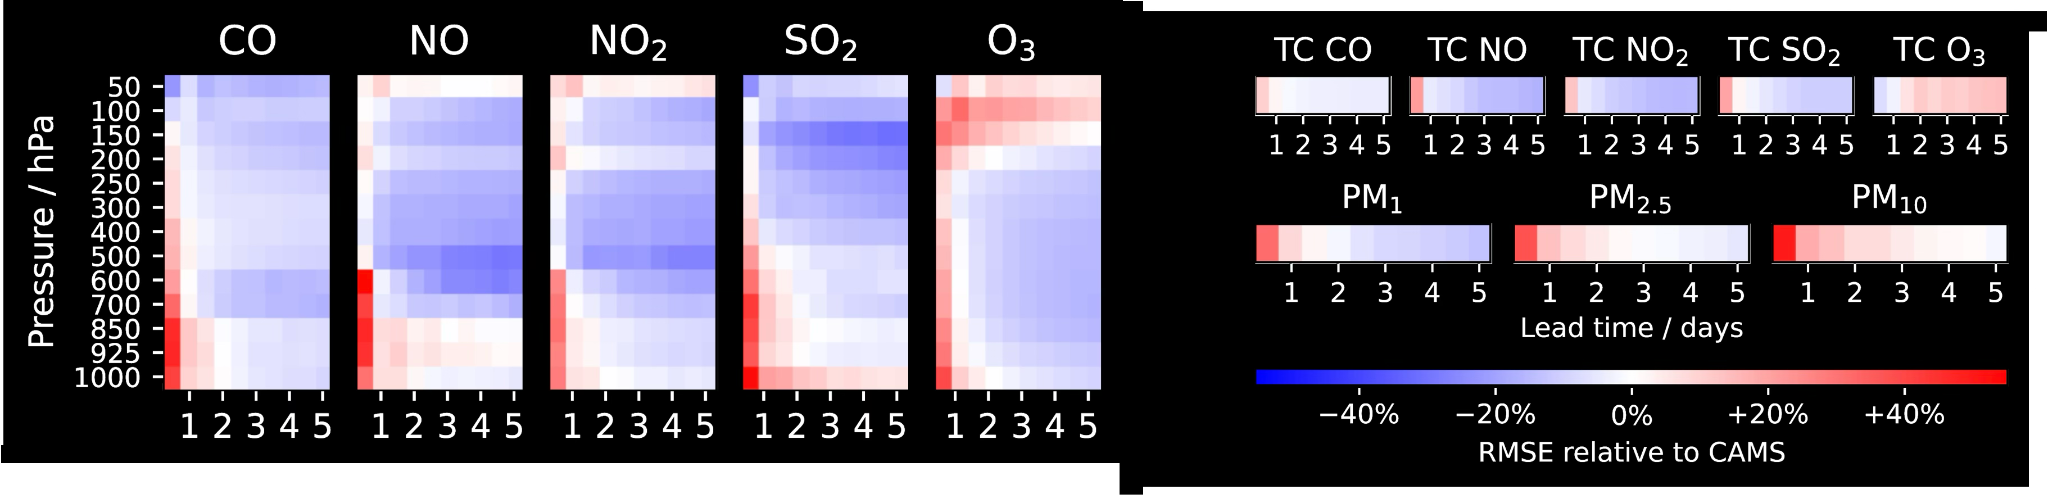
Air-quality RMSE relative to CAMS, across pollutants, levels and lead times Three-day lead-time highlight Three-day lead-time highlight Three-day lead-time highlight Three-day lead-time highlight Three-day lead-time highlight Three-day lead-time highlight Three-day lead-time highlight Three-day lead-time highlight Three-day lead-time highlight Three-day lead-time highlight Three-day lead-time highlight Three-day lead-time highlight Three-day lead-time highlight
Ranked Aurora versus CAMS RMSE at three days lead time RMSE = root-mean-square forecast error · Compared across pollutants, levels and lead times · Aurora, Nature 2025

Iraq’s severe sand storm

13 June 2022 · Aurora captures the dust plume a day ahead
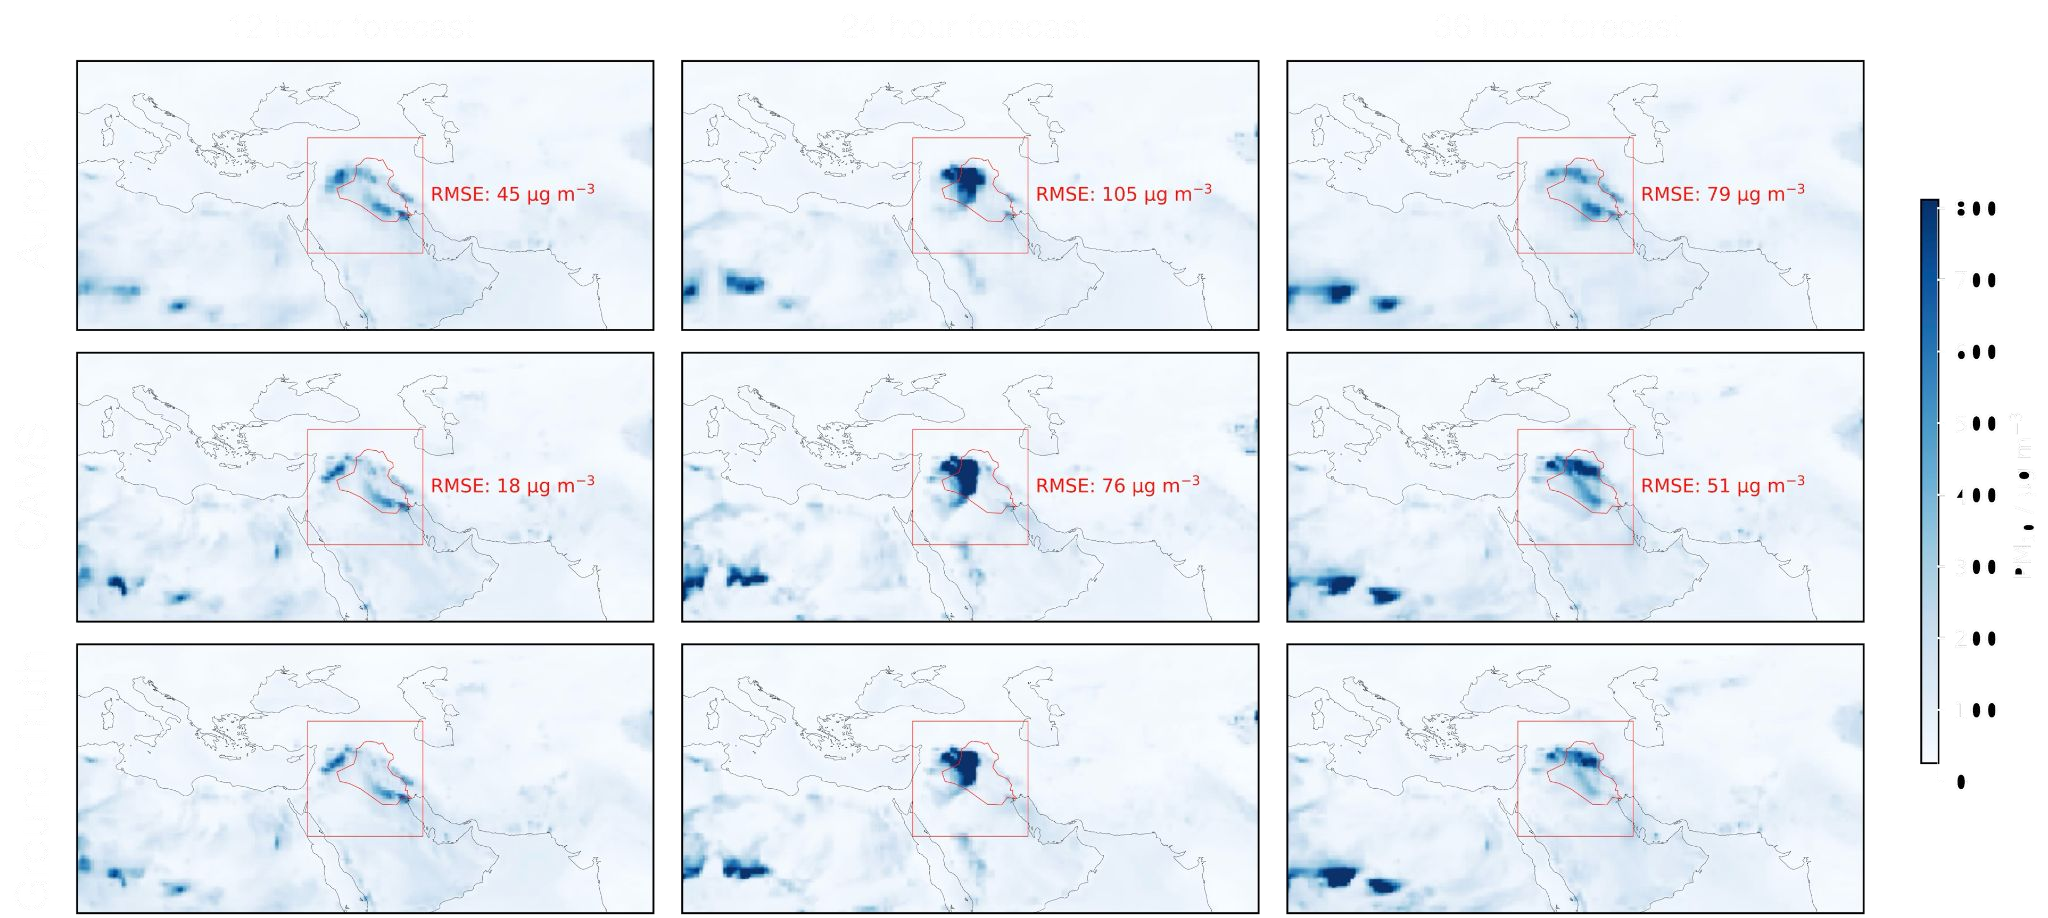
Aurora, CAMS and ground truth for the Iraq sandstorm at 12, 24 and 36 hours Darker blue = higher airborne-particle concentrations (PM₁₀) · Red box: Iraq evaluation region · Aurora, Nature 2025

Atmospheric dynamics
coupled to wave dynamics

Atmospheric winds

Surface roughness
changes wind drag

Energy transfer

Swell travels outward

Forecast the sea state

Height    Period    Direction

Schematic wind–wave coupling · NOAA National Ocean Service / NDBC

Capturing extreme ocean waves

Typhoon Nanmadol · South of Japan · 17 September 2022 · 24 hours ahead
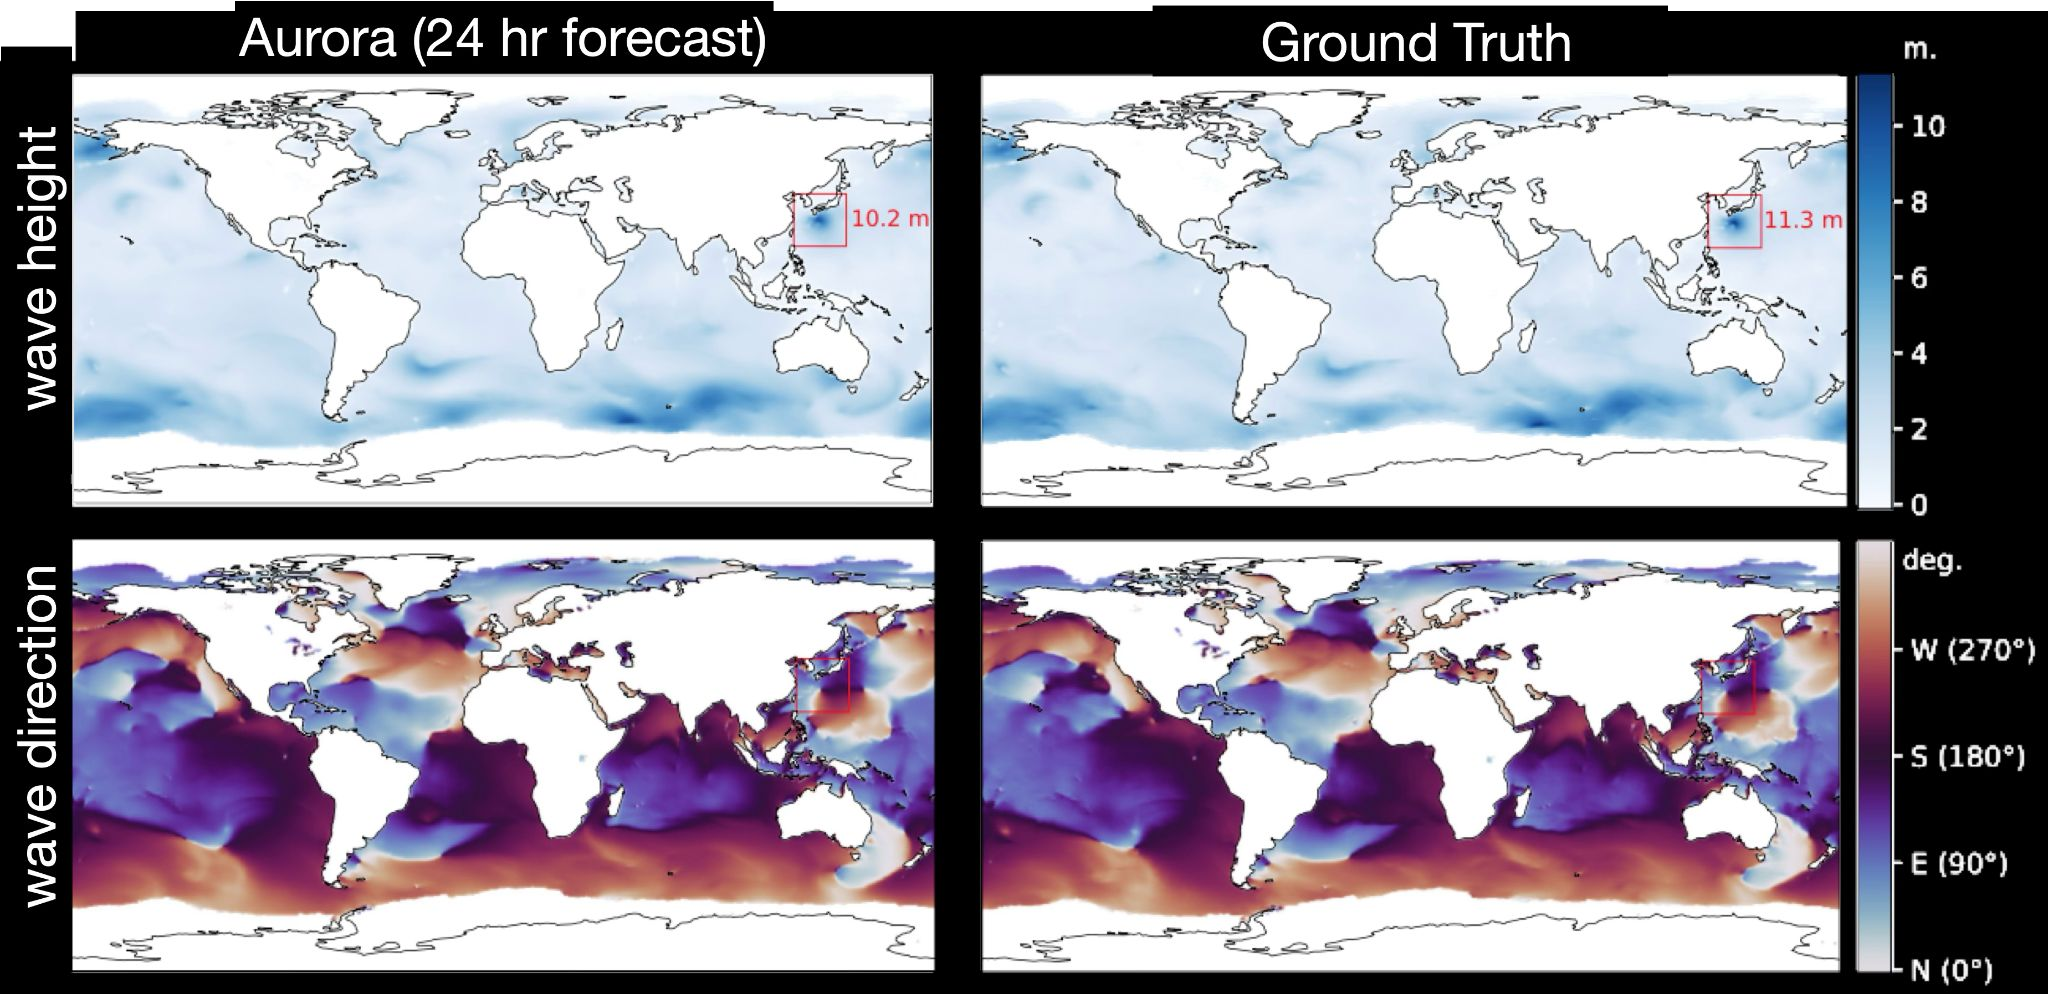
Aurora wave height and mean wave direction compared with ground truth at a 24-hour forecast horizon Top: significant wave height · Bottom: mean wave direction · Red box: typhoon region · Aurora, Nature 2025

Ocean waves vs HRES-WAM

HRES-WAM: ECMWF’s high-resolution physics-based ocean-wave model
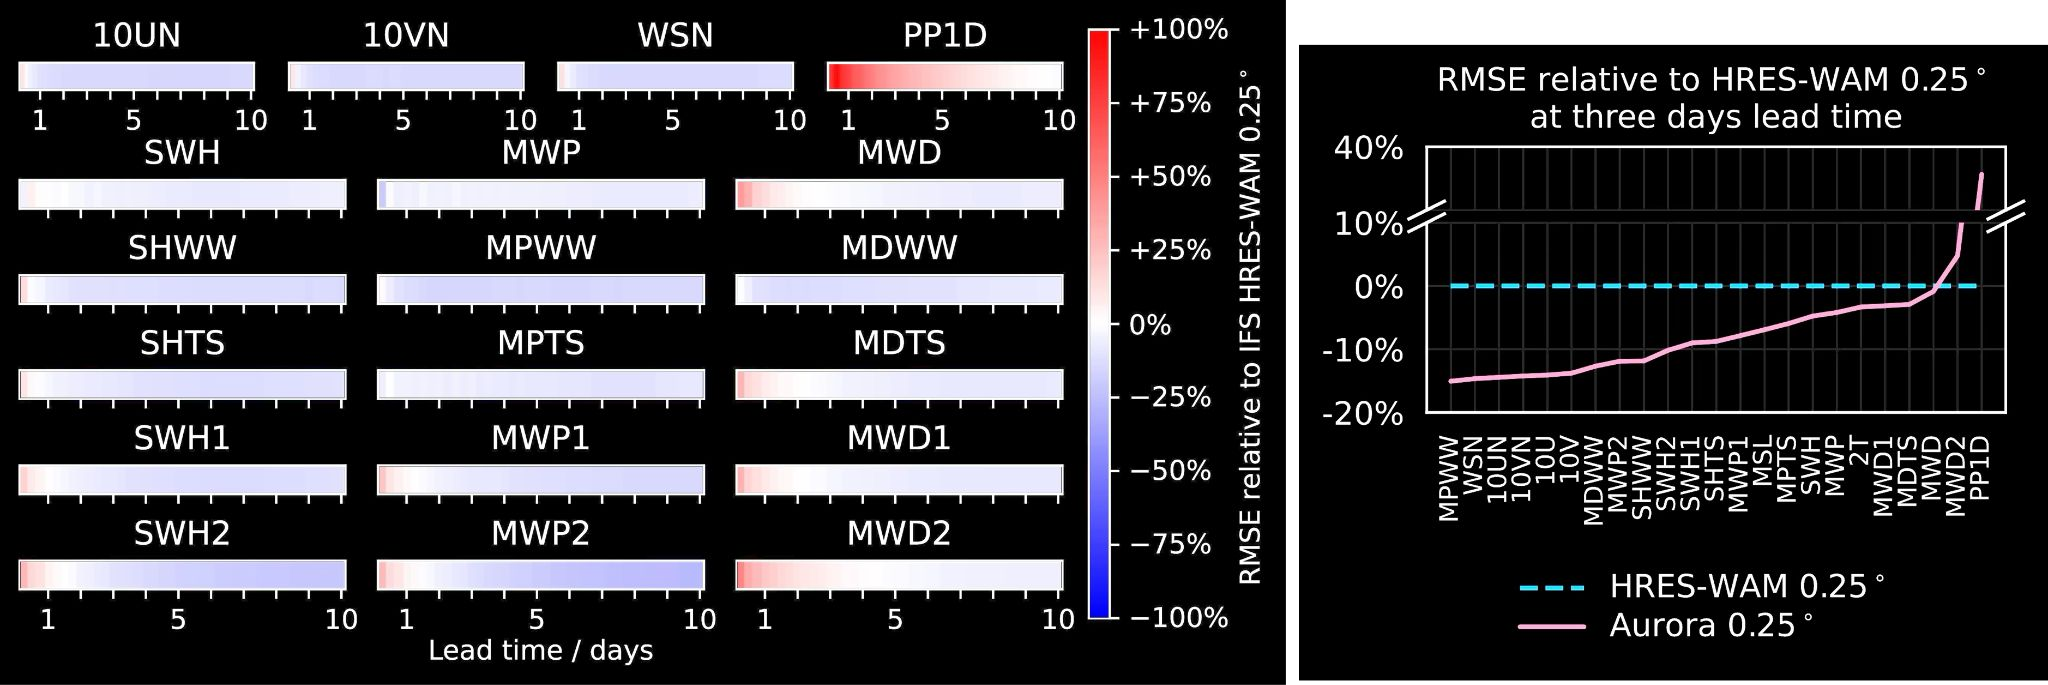
Wave-forecast RMSE relative to HRES-WAM across variables and lead times, including the ranked three-day comparison Below zero → Aurora has lower forecast error · Baseline: European Centre for Medium-Range Weather Forecasts · Aurora, Nature 2025

Tropical cyclone forecasting

Outperforms official forecasts from government agencies
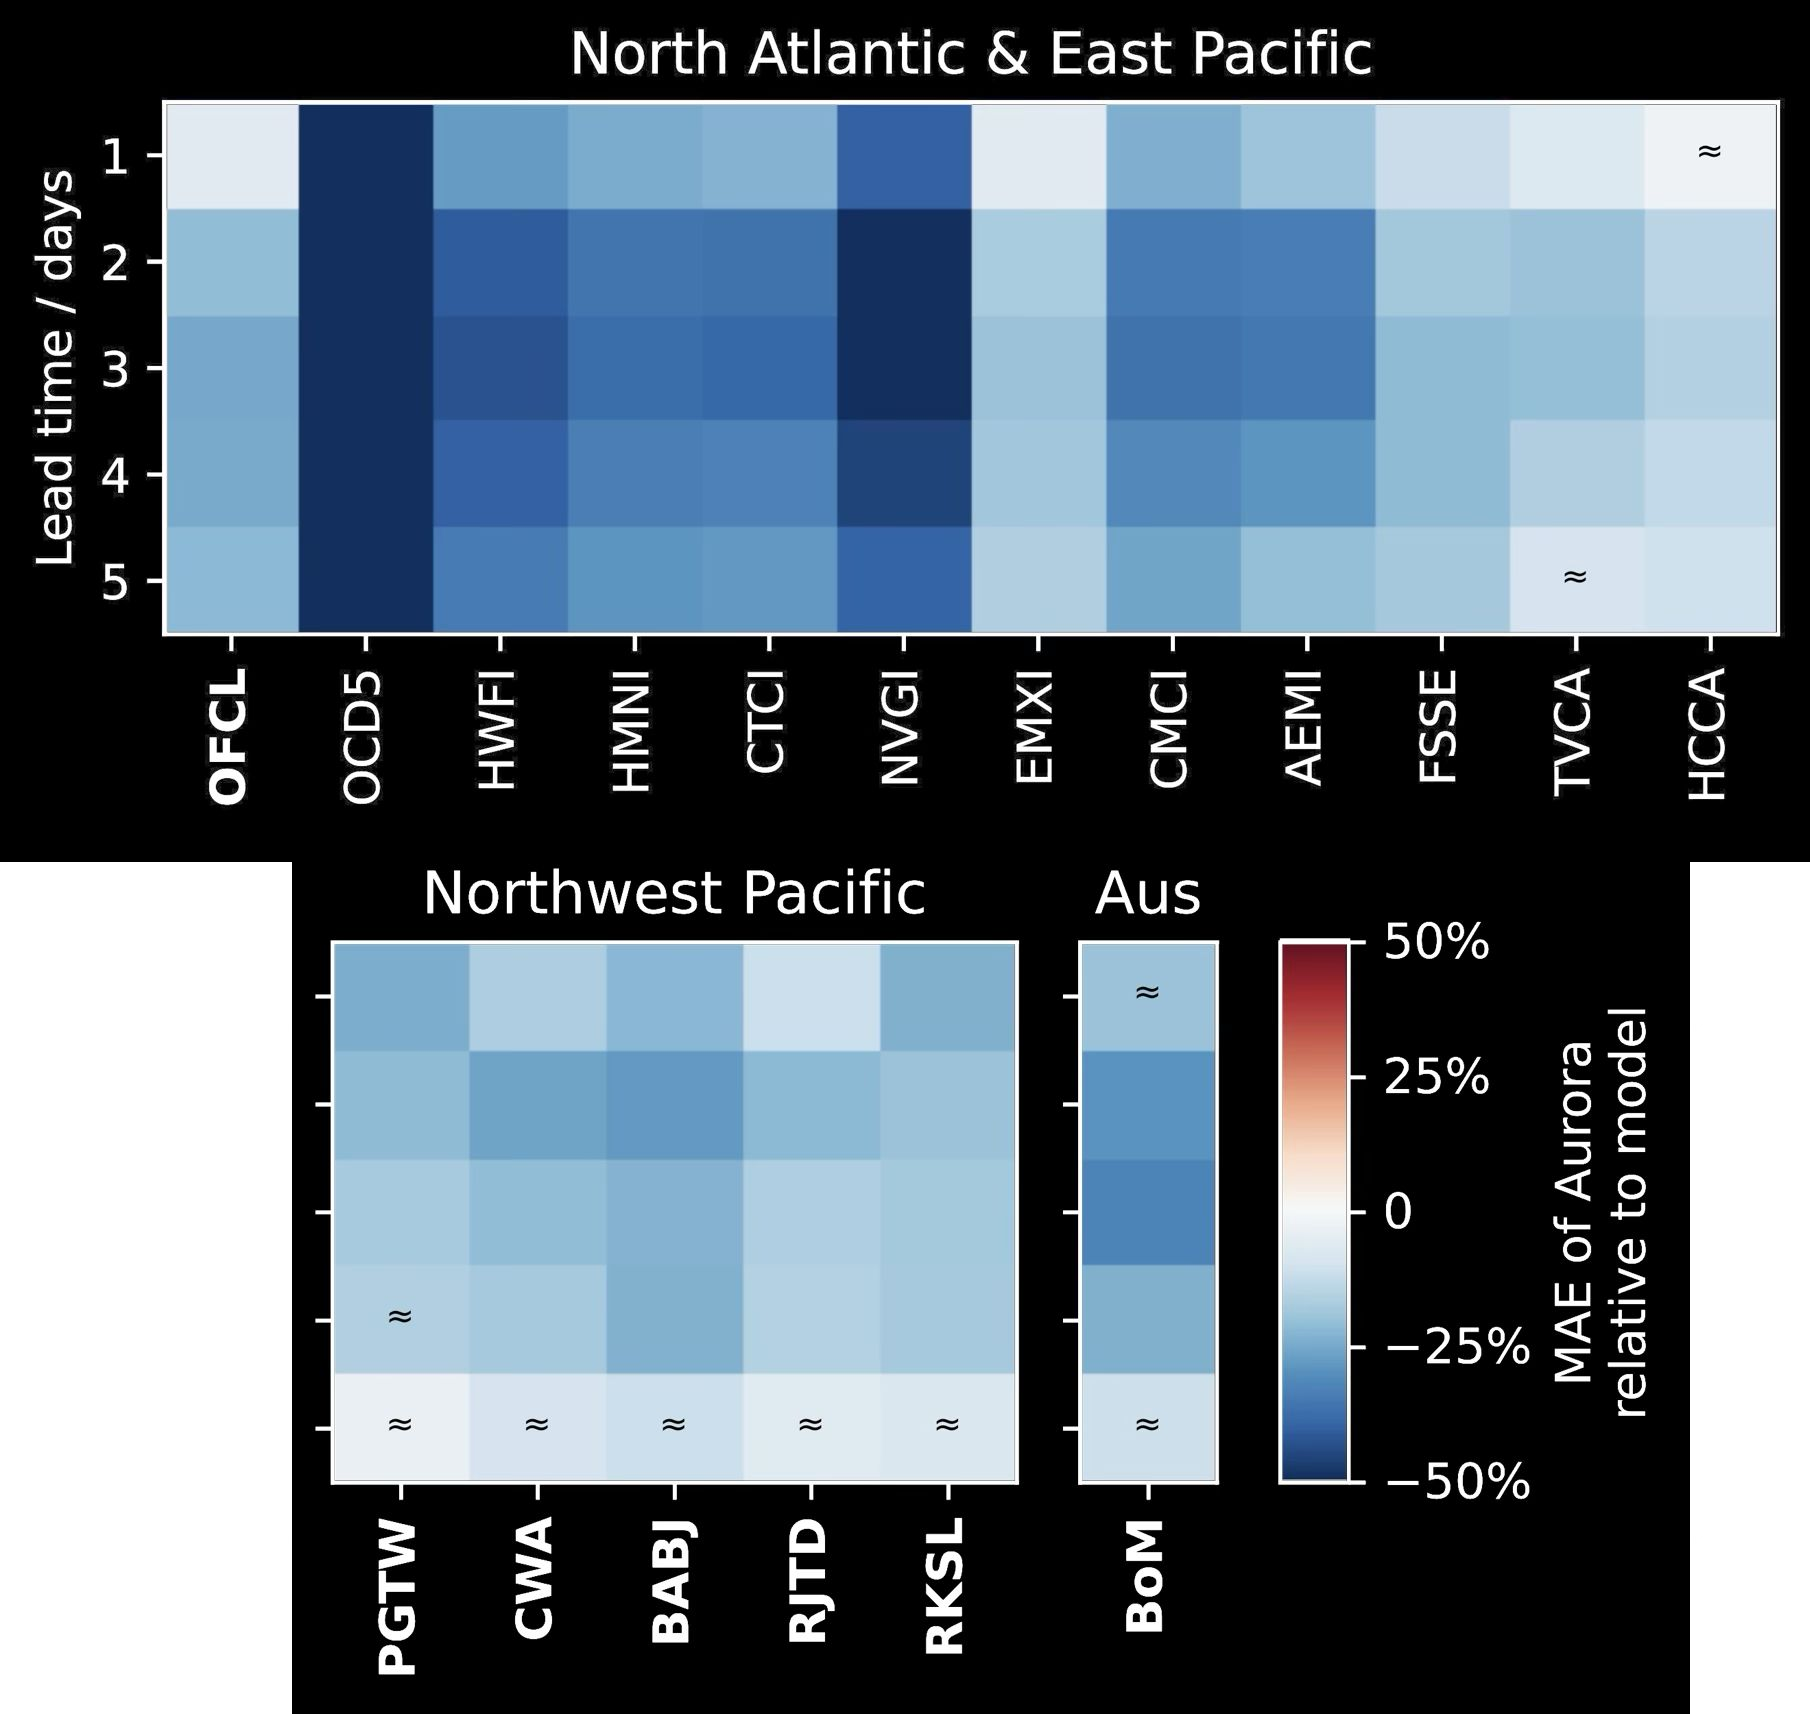
Track MAE relative to operational forecasts across three ocean basins
OFCLUS National Hurricane Center PGTWUS Joint Typhoon Warning Center BoMAustralian Bureau of Meteorology

Bold labels: official agency forecasts. Other labels: model guidance and statistical baselines.

2022–2023 evaluation · Track MAE; negative values indicate lower error · Aurora, Nature 2025

Rime ice

Supercooled droplets freeze on contact.

Liquid water below 0°C Wind Power line Cross-section Ice builds up

Local clouds

Where is the liquid water?

Wind & droplet transport

What reaches the line?

Freezing & ice growth

How much ice accumulates?

Small-scale clouds. Complex microphysics. Sparse observations.

Conceptual schematic · Ice loading can cause line failures · Bodnar et al. (2025), §3.1

Post-training for rime ice

Weather foundation model + Hydro-Québec observations

Power network

Romaine1 · 2 · 3 · 4 Manic–Outardes La Tuque Beauharnois St. Lawrence Québec Montréal
Generating stations Transmission

Average precision · higher is better

Post-trained AI model Physics model with hindsight† Climatology 0.72 0.53 0.37 00.51.0

24-hour icing · 14 monitoring sites

† Makkonen index from ERA5 reanalysis,
not an operational forecast.

Schematic · selected power facilities, not to scale · Fig. 2 Silurian × Hydro-Québec · Bodnar et al. (2025), Fig. 3a

Do these models
learn the physics?

Recovering seasonal temperatures

Aurora · Two-year rollout

2,920 consecutive six-hour predictions · Arctic surface temperature
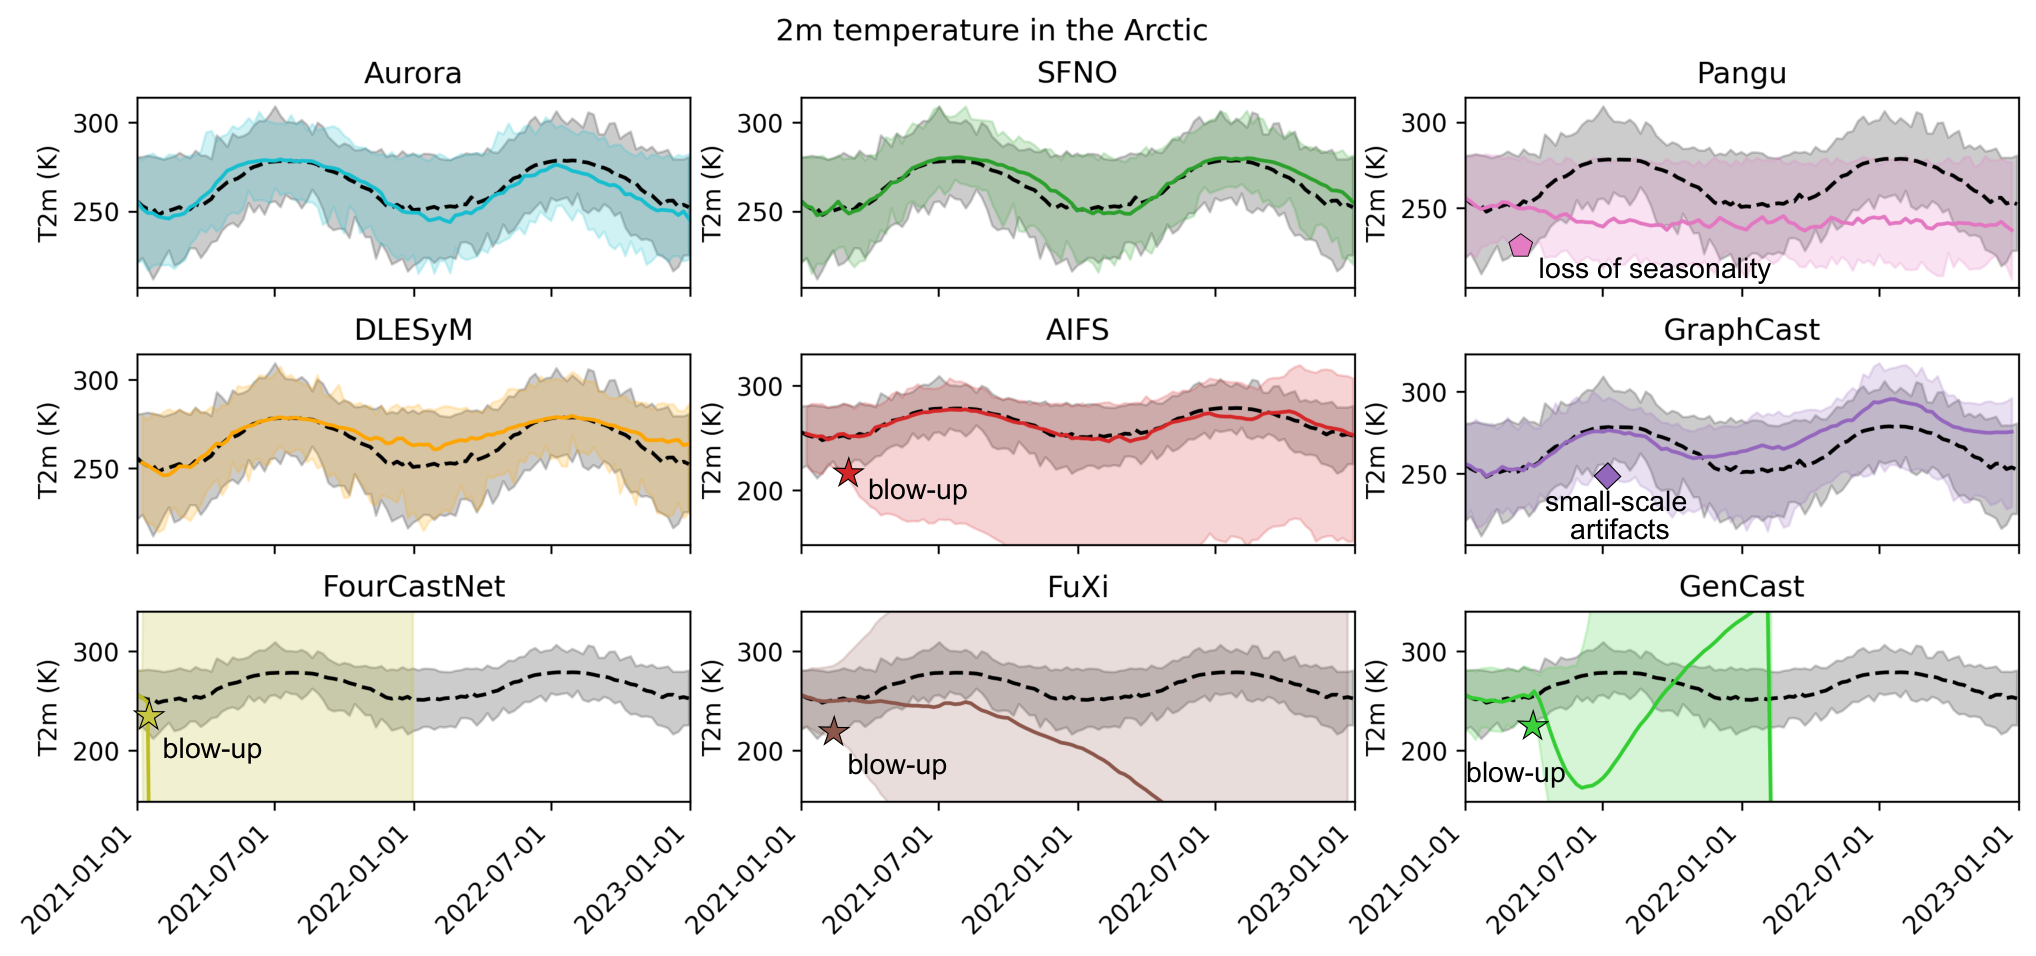
— Aurora– – ERA5 reanalysis
Jan 2021Jul 2021Jan 2022Jul 2022Jan 2023

Lines: regional means · Shading: spatial min–max · Calendar date supplied to the model

Lehmann et al. (2026), Fig. 1 · Aurora panel; colors adapted for dark background · arXiv:2605.30184

Textbook simulations

Pangu-Weather · An idealized dynamics test

0 h · Height disturbance; no wind anomaly
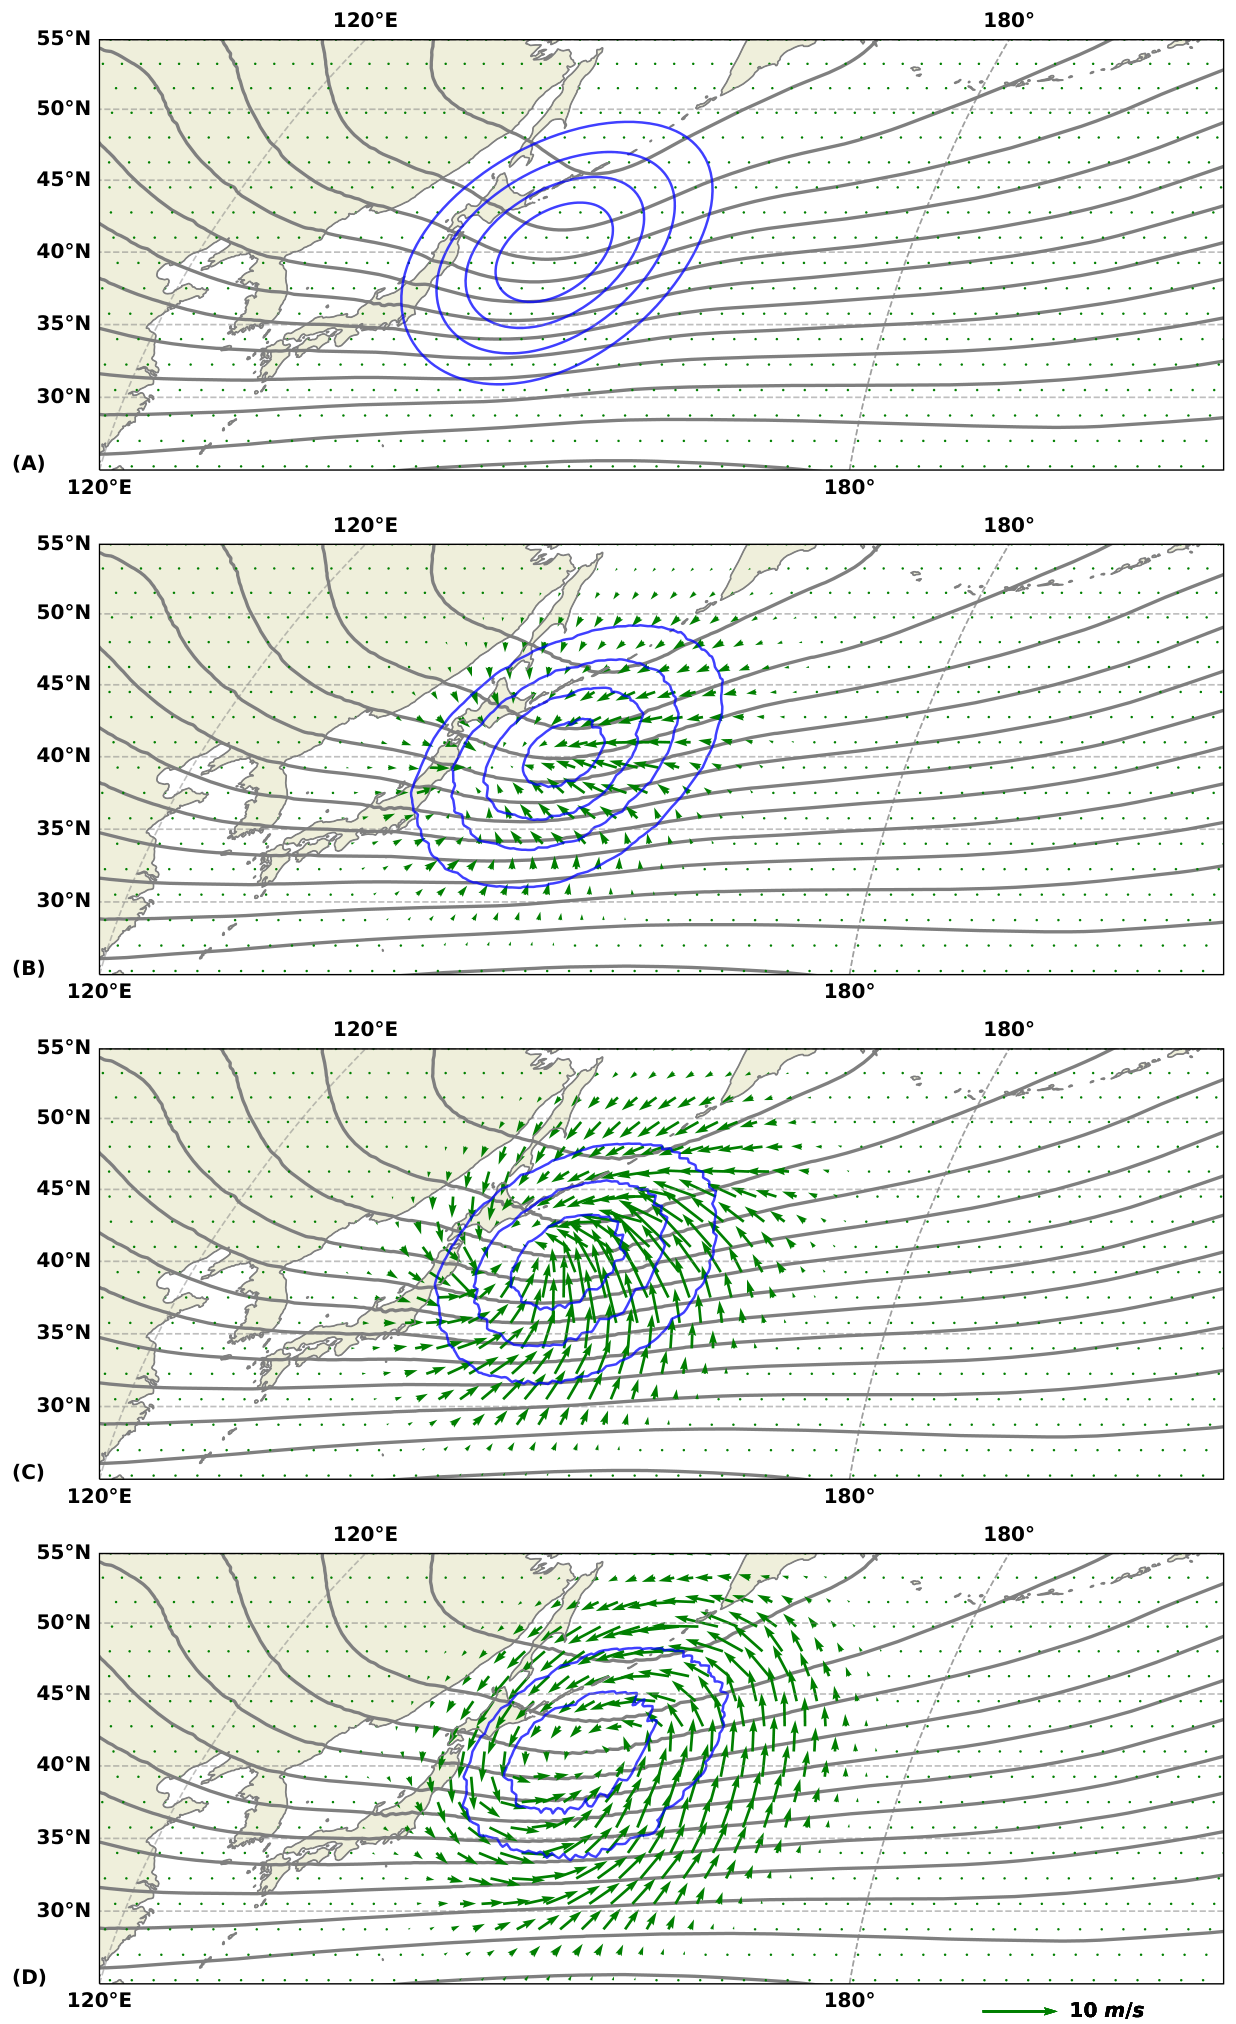
1 h · Winds accelerate toward the disturbance

3 h · Winds turn under the Coriolis effect

6 h · Winds approach balance with the height field

Blue: height anomaly · Green: wind anomaly · Grey: full height field · 500 hPa

Hakim & Masanam · Fig. 5, arXiv:2309.10867 (2023); published 2024 · CC BY-SA 4.0 · Panels isolated and colors adapted
So why haven't we solved
fluid dynamics yet?

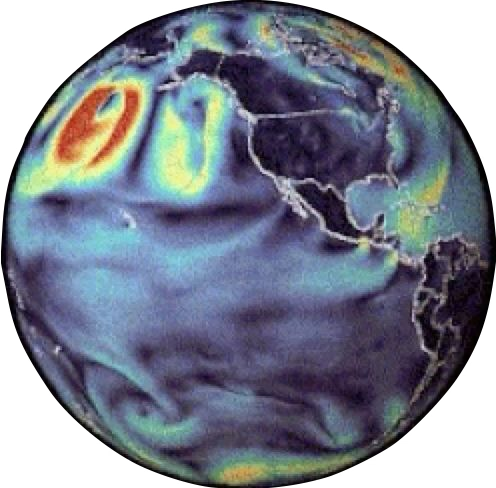
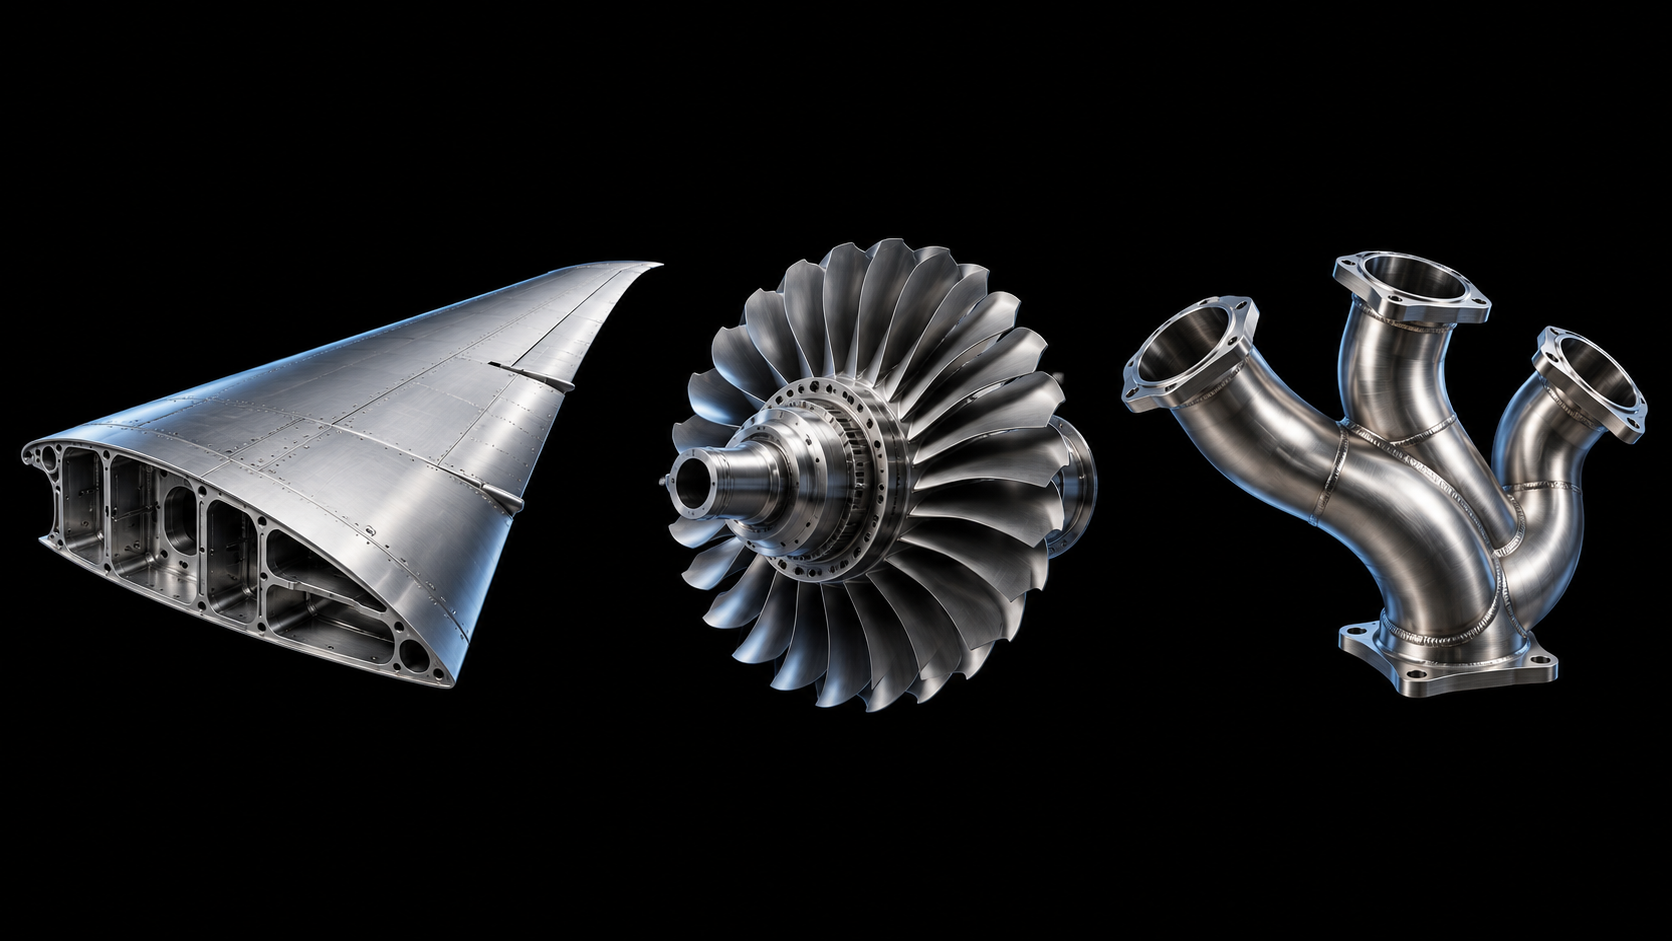
Earth: the common geometry of weather forecasting A wing, turbine and pipe manifold illustrate the diversity of engineering geometries
WeatherBroader CFD
GeometryOne geometryUnlimited geometries
MeshingEstablished global gridsHard to automate
Simulation dataExtensive archivesSmall public datasets
MeasurementsRich observationsVery little experimental data
Engineering objects are conceptual illustrations

Thank you

Cristian Bodnar

Project Prometheus

cbodnar@prometheus.ai